

· documentation · 3 min read
Profiling Odoo Performance with py-spy
Over time — day after day, week after week — the amount of data grows, here is how to pinpoint what might cause the slowness.

Sometimes, our Odoo system runs smoothly, but over time — day after day, week after week — the amount of data grows. Every time we create or update records, the database size increases.
Some methods or functions that once worked well with a small dataset may now slow down — sometimes significantly. While inspecting log messages can help identify performance issues, but we can’t log every function execution.
Today I want to show you, how can we investigate our odoo application what does it doing behide the scene to check which function is the problem by using py-spy
py-spy is a lightweight Python profiler that helps analyze performance bottlenecks in running applications without modifying the code or restarting the system. It’s perfect for debugging Odoo slowdowns efficiently.
What do you need before starting?
- Odoo application (In this tutorial, I used Odoo version 18)
- Docker Compose (Used to run the Odoo application and the py-spy service)
Note: on this article I install odoo with doodba you can follow this link https://github.com/Tecnativa/doodba-copier-template
Let’s start Assume you’ve already run odoo application with docker-compose.
With py-spy, you can profile Odoo without modifying any lines of code. You just need to set up a new service pyspy in the docker-compose.yml file, that is used to run Odoo.
Create directory pyspy in the same path of docker-compose.yml inside pyspy create Dockerfile with code below
.
├── app #odoo source code
├── docker-compose.yml
├── pyspy
    └── Dockerfile
# pyspy/Dockerfile
FROM python:3.6
RUN pip install py-spy
WORKDIR /profiles
ENTRYPOINT ["py-spy"]
CMD []
- Add pyspy service in the same docker-compose.yml of odoo as below
services:
   pyspy:
     build:
       context: pyspy/
     pid: "host"
     privileged: "true"
     volumes:
       - .:/profiles
- Start the Odoo server and ensure it is running by going to localhost:18069 (Doodba provides this port for Odoo 18).
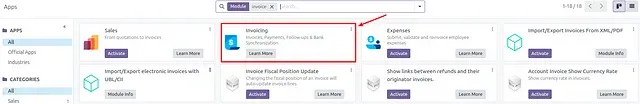
I just installed invoicing app for test if pyspy work as we expect (we will test this later)
- When you run Odoo, it will automatically build the odoo18-pyspy image. Please check it using the following command
$ docker image ls | grep pyspy
![]()
- Before use pyspy to profilling our odoo application we need to get PID of odoo container by running this command
$ docker inspect — format ‘{{.State.Pid}}’ <your_odoo_container>
![]()
Then run
$ docker-compose run pyspy record -o myprofile.svg — pid <PID>
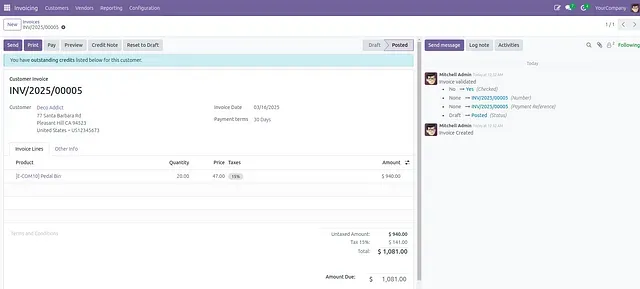
Back to odoo and try to do some action like create new invoice.
![]()
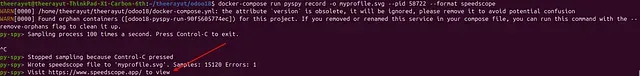
After comfirm invoice you go back to the terminal press Crtl+c then watch out in you directory you will find myprofile.svg open it on your browser

![]()
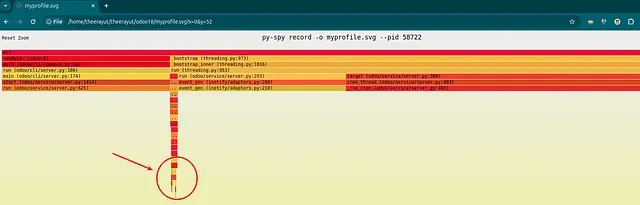
You can click there to explore more details about which function is called.
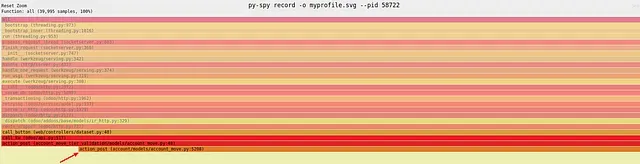
On the horizon axis represents the total number of samples collected. So the larger the area, the more time has been spent executing the associated function. The vertical axis represents the depth of the call stack. So the higher the peak, the deeper the call stack. Colors don’t represent anything specific; they’re just there to make a visual contrast.
For more detail you can create profiles in the speedscope by run this command
$ docker-compose run pyspy record -o myprofile.svg — pid <PID> — format speedscope
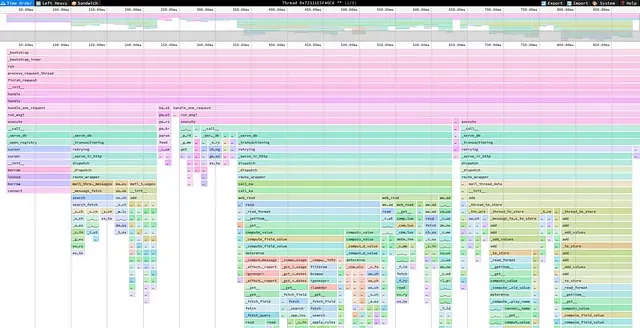
Upload myprofile.svg to https://www.speedscope.app/
Conclusion
Finally, using py-spy helps pinpoint performance bottlenecks in Odoo without code changes. Optimize slow functions, boost efficiency, and keep your system running smoothly.
You can learn more about using py-spy to profiling python application by go to https://bruinsslot.jp/post/profiling-python-docker/
By Theerayuth A.